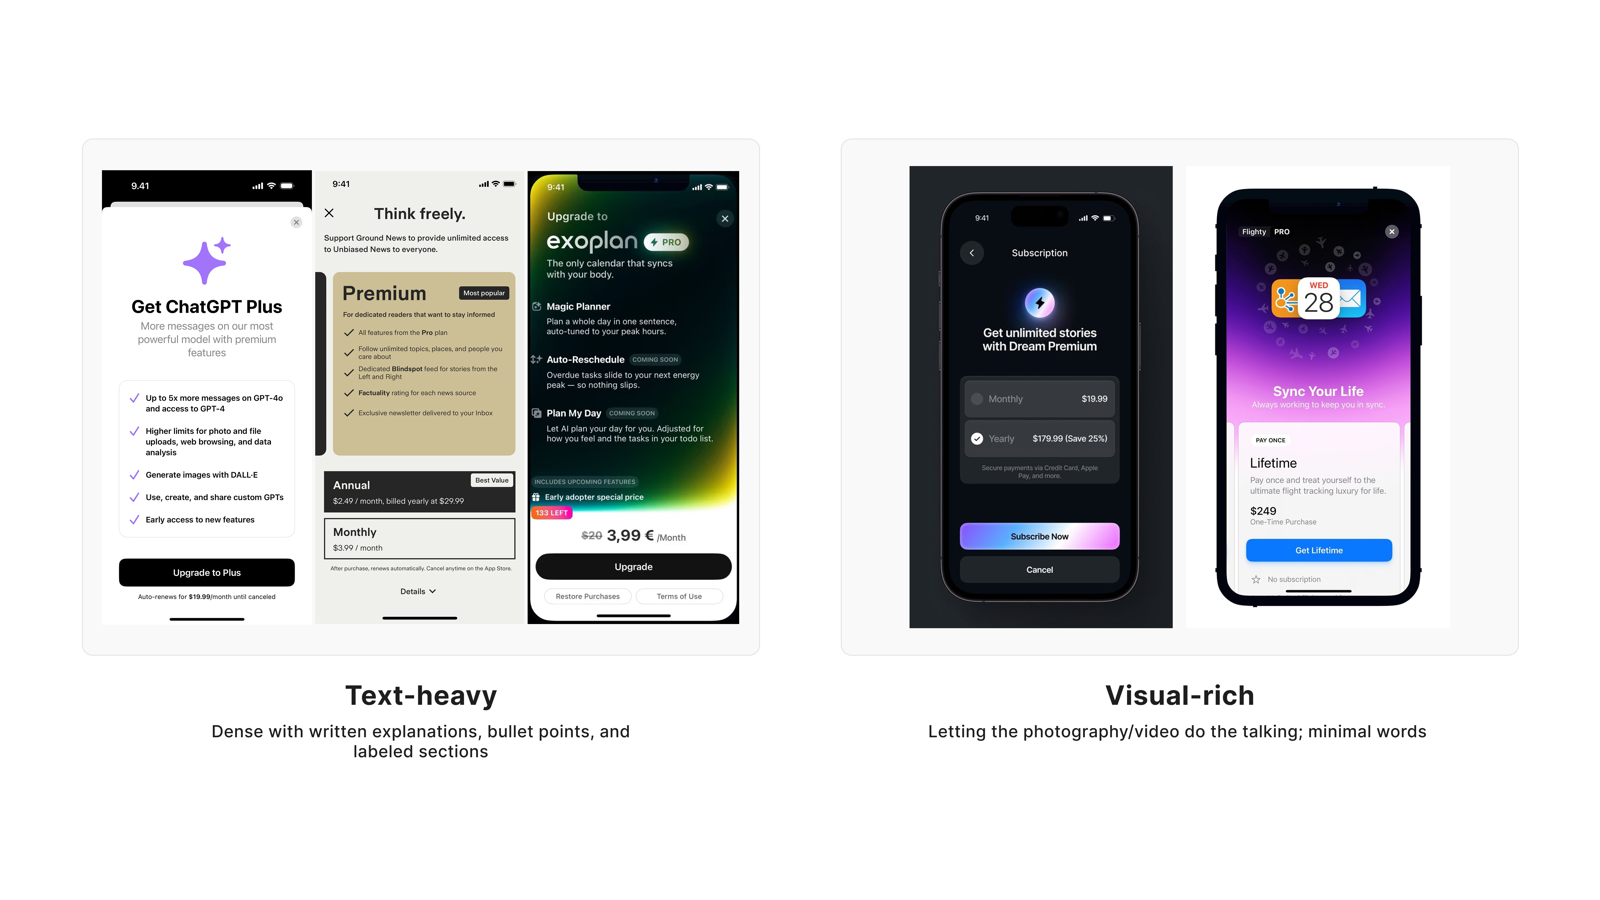
用户偏好调研

Tapo Care 订阅页
设计偏好调研

基于 Semantic Differential Scale 的 7 维度可执行设计原则

表象之下的模式

用户在三个维度表达了表面矛盾的偏好:他们要详细信息(Need 4),要场景说明(Need 5),又要视觉优先不被文字淹没(Need 6)。这不是矛盾,而是同一个 need 在不同维度的折射——"让我能拿到深度信息,但默认不被淹没"

把这三条 need 放在一起读,就能看到同一个设计模式:progressive disclosure / on-demand depth。默认展示轻量概览,让用户自行决定是否挖深。这不是折中,而是真正符合用户心智模型的信息架构。

更进一步,7 个看似独立的设计维度,在用户口中其实指向同一条产品策略。Real Photos 提供真实感让用户信任(Need 1),Intuitive 减少操纵感让用户控制(Need 2),Comparative 减少记忆负担让用户比较(Need 3),progressive disclosure 让用户自主决定信息密度(Need 4/5/6),Abstract/Explicit 的张力体现高端感与清晰度的取舍(Need 7)。底层共同的驱动力是:在安防订阅场景里,用户的核心心理需求是透明与掌控,而非说服与情绪共鸣

Tapo Care 订阅页 v1 设计前,UX Research 团队对 289 名美国用户进行了 Semantic Differential Scale 调研(双 cohort 设计:V1 matrix n=253 + V2 inverse slider n=36),覆盖 7 对视觉与信息架构维度。本报告以开放回答的用户声音分析为主体——评分数据有局限(用户在多个维度展现冲突偏好,single-direction % bar 不足以传达 nuance),但 quote 揭示了用户真实的 need 和偏好背后的理由。

1
Real Photos vs Illustrations
"Show me real homes, not stock art"
● 强共识
设计原则
在安防订阅页使用真实家居场景照片,避免插画和 AI 合成人物——真实感是信任的前提,不是审美偏好。

用户对安防产品的信任建立在"真实"上。大多数用户明确说照片帮助他们判断产品和自己的生活是否相关;反对真实照片的声音主要来自隐私焦虑,而非对插画的审美偏好。

量化分布 · Quantitative Distribution
V1 matrix (n=254)
35.4%
11.8%
52.8%
V2 slider (n=38)
65.8%
26.3%
Real Photos
中立
Illustrations
用户评论

"This makes the app feel more realistic and trustworthy, especially for a home security product."

"真实照片让 app 看起来更可信,这对家庭安防产品来说很重要。"

V2 cohortAge 25–34Income $150,000+Sub $20–$29.99

"Real photos increase trust and help me make a perfect decision."

"真实照片增加信任感,帮我做出更好的决定。"

V2 cohortAge 35–44Income Over $100,000Sub $20–$29.99

"Real photos are important to me. It gives me a better visual of what is happening."

"真实照片对我来说很重要,能让我更直观地看清实际情况。"

V1 cohortAge 35–44Income $75,000–$99,999

"Real photos make me visualize a realistic scenario of how the product would be used and whether it would be useful for me."

"真实照片能帮我想象产品在实际生活中怎么用,判断对我有没有价值。"

V1 cohortAge 25–34Income Under $25,000

"Illustrations best because it makes me not think about the camera recording me as well."

"插图好,这样我就不会想到摄像头也在录我自己。"

V1 cohortAge 25–34Income $75,000–$99,999

"I prefer illustrations because I don't want to imagine someone else's family."

"我更喜欢插图,因为我不想看别人家里的场景。"

V1 cohortAge 18–24Income $50,000–$74,999

"Never use AI people who are supposed to 'look realistic' — either direction, keep the style honest."

"绝对不要用那种'看起来像真人'的 AI 生成图——无论哪个方向,风格一定要诚实。"

V1 cohortAge 45–54Income Over $100,000

"Real photos risk feeling like stock imagery; illustrations feel more intentionally designed."

"真实照片有时像素材库图,反而插图看起来是有意设计过的。"

V2 cohortAge 18–24Income Less than $25,000Sub $20–$29.99
Visual Stimulus
Real Photos vs Illustrations 设计对比
用户视角总结
用户喜欢真实照片,因为
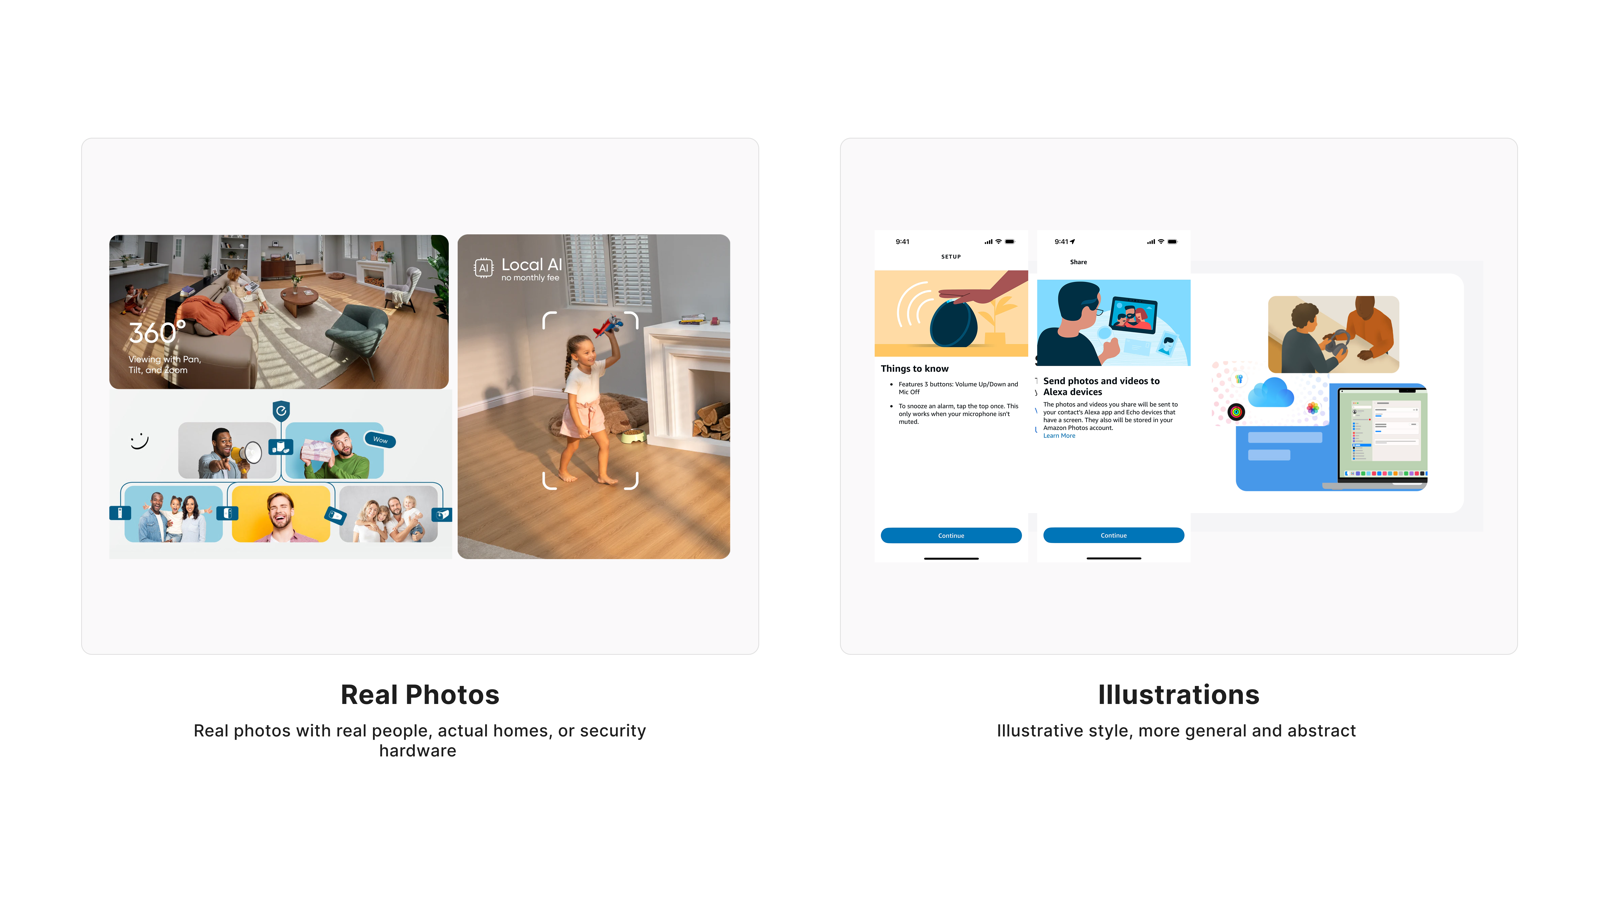
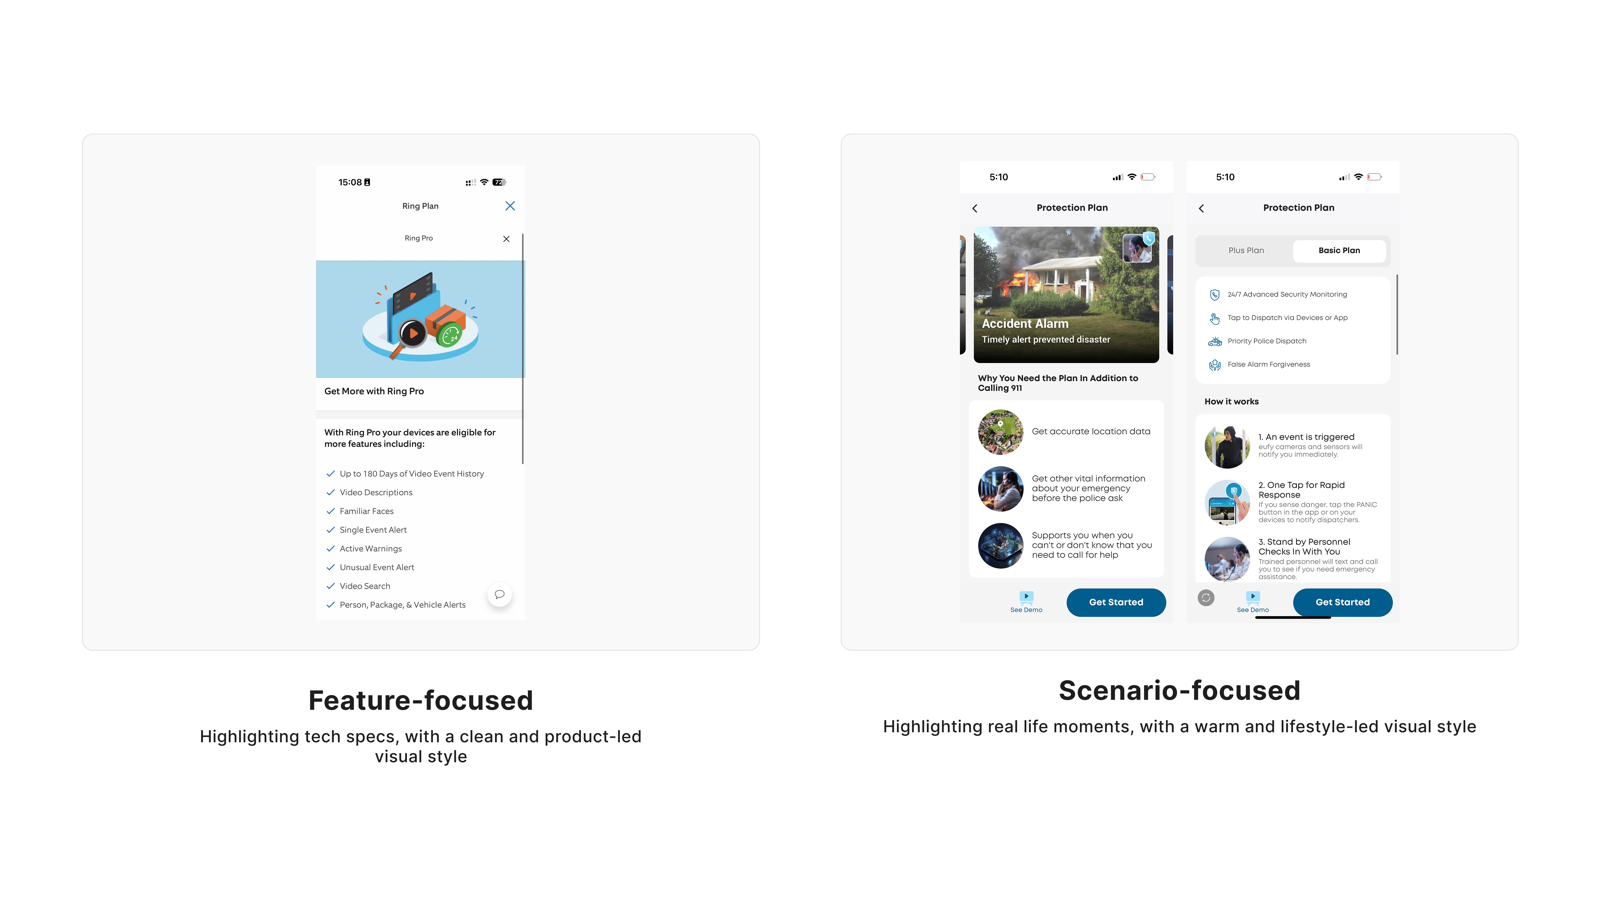
  • 让产品看起来可信、真实,符合安防场景对信任的要求
  • 帮助判断产品在自己家里会是什么样,降低决策门槛
  • 比插画更直观,能看清产品实际安装状态
  • 建立用户与产品的即时连接,带动订阅意愿
用户不喜欢真实照片,因为
  • 不想看别人家的场景,产生隔离感
  • 会想到自己也被摄像头录制,触发隐私焦虑
  • 如果使用 AI 合成人物,感觉不诚实,反而损害信任
  • 低质量真实照片(素材库图)反而比精心设计的插画更差
Tapo Care 的设计回应
  • 订阅页主视觉使用真实家居场景中的产品照片,展示产品在实际环境中的安装状态
  • 照片中避免出现真实人物面孔或可识别家庭成员,用空间和设备本身传达安全感
  • 照片画质清晰,产品细节可辨,品牌感知传达安全、可靠、真实
  • 避免使用风格化插画或 AI 合成的"写实人物"作为主视觉
  • 照片与权益描述形成视觉呼应,不单纯作为装饰背景
Quant support(辅证):V1 matrix (n=254) 偏 Illustrations 52.8% / Real Photos 35.4%;V2 inverse slider (n=38) 大幅翻转:Real Photos 65.8% / Illustrations 26.3%。V1 vs V2 差值显著,为 6 个出现偏好翻转的维度之一,提示 V1 受 hypothetical bias 影响,以 V2 结论为准。
2
Intuitive vs Emotional
"Don't sell me, let me decide"
● 强共识
设计原则
订阅页的任务是帮助用户做决定,不是说服他们安全很重要——用户早就知道了,不需要被情绪化语言推着走。

大多数用户明确拒绝情绪化设计,原因是他们把情绪化 UI 等同于"被操控"。少数偏好情绪化的用户,细读他们的理由,实际上是在说"场景代入感",而非"恐惧语言"。

量化分布 · Quantitative Distribution
V1 matrix (n=254)
35.0%
11.5%
53.5%
V2 slider (n=38)
68.4%
15.8%
15.8%
Intuitive
中立
Emotional
用户评论

"Intuition always because I want to get things done. I don't need any sugar coating."

"我就要能用的,不用包装得花里胡哨。"

V1 cohortAge 25–34Income $50,000–$74,999Sub $20–$29.99

"I am busy — I want it quick and intuitive to understand."

"我很忙,能快点看懂就行,别绕弯子。"

V1 cohortAge 35–44Income Over $100,000Sub Under $10

"Again, better looking and smarter because we don't need to be convinced that security is important."

"不用说服我安全很重要——我早就知道了,别费这劲。"

V1 cohortAge 45–54Income $25,000–$49,999Sub $10–$19.99

"Intuitive is better because I want to feel like I accomplished something rather than feeling something from the UI."

"直觉式设计更好——我要的是完成任务的感觉,不是被 UI 勾起情绪。"

V1 cohortAge 25–34Income $25,000–$49,999

"It feels easier to navigate and makes it quicker to understand the subscription and take action."

"一眼就能看懂订什么、下一步干嘛,不用动脑子。"

V2 cohortAge 25–34Income $150,000+Sub $20–$29.99

"I am goal oriented. When you focus on tasks and goals, it is more relevant to me."

"我是目标导向的人,把任务和目标说清楚比什么都强。"

V1 cohortAge 35–44Income $75,000–$99,999Sub $10–$19.99

"I think this one heavily depends on the person but emotionally-centered works way better for me — it connects with why I want security."

"我觉得这很因人而异,情感化对我更有效——能连接到我想要安全感的原因。"

V1 cohortAge 18–24Income Over $100,000

"I prefer a more intuitive design because it makes it quick and easy to understand the plan and take action."

"我更喜欢直觉式设计,能快速理解方案然后直接行动。"

V1 cohortAge 25–34Income $50,000–$74,999
Visual Stimulus
Intuitive vs Emotional 设计对比
用户视角总结
用户喜欢直觉式设计,因为
  • 他们进订阅页是来完成任务的,不是来接受情绪引导的
  • 安全的重要性他们早就知道,不需要被反复强调说服
  • 清晰导航本身就是一种说服力,效率就是信任
用户不喜欢情绪化设计,因为
  • 感觉被操控,像是被推着做决定而非自主选择
  • 情绪化文案往往混淆了信息,反而让人不知道该怎么行动
  • 恐惧语言在安防场景里适得其反,会让用户怀疑品牌动机
Tapo Care 的设计回应
  • 信息层级清晰,用户能在 5 秒内定位订阅计划对比和关键价格
  • 文案直接描述权益,不使用恐惧、焦虑类语言(如"你的家正处于危险中")
  • 订阅和取消路径透明,避免暗藏操作或强迫用户滑动才能看到完整信息
  • 避免用夸张安全威胁场景制造紧迫感;用"你能做到什么"替代"如果不订会怎样"
Quant support(辅证):V1 matrix (n=254) 偏 Emotional 53.5% / Intuitive 35.0%;V2 inverse slider (n=38) 大幅翻转:Intuitive 68.4% / Emotional 15.8%。这是 7 个维度中 V1 vs V2 反差最强烈的一项,偏好方向几乎完全逆转,以 V2 + qualitative 双重一致为准。
3
Standalone vs Comparative
"Let me see plans side by side"
● 强共识
设计原则
订阅计划默认并排呈现,让用户一眼看完差异——来回翻页不只是不便,还让用户觉得系统在刻意隐藏信息。

这是 7 个维度里共识最强的一项。用户对并排对比的诉求来自决策效率,不是视觉偏好——他们知道自己需要比较,而来回翻页打断了这个判断过程。

量化分布 · Quantitative Distribution
V1 matrix (n=254)
72.0%
20.1%
V2 slider (n=38)
60.5%
36.8%
Comparative
中立
Standalone
用户评论

"It will enable me compare the both layout at once without going back and forth."

"两个方案摆一起,不用来回翻,一次全比清楚。"

V2 cohortAge 25–34Income $75,000–$99,999Sub $20–$29.99

"Having all options at once to compare helps make a decision better. Having to go back and forth is too much of a hassle."

"所有选项摆一起才好做决定,来回翻太麻烦了。"

V1 cohortAge 25–34Income $25,000–$49,999

"I like the comparative one as I can quickly scan and see the tiers available."

"对比版很好用,扫一眼就把所有档位看完了。"

V1 cohortAge 45–54Income $50,000–$74,999Sub Under $10

"I really liked the comparative layout because it makes it easy to compare plans side-by-side and understand the differences."

"对比布局很好,并排放能轻松看清楚方案差异。"

V1 cohortAge 25–34Income $50,000–$74,999

"I want to see all my options right up front with a way to easily compare them. Standalone feels time-wasting and unnecessary."

"我要一进来就能看全、能比较,单独展示太浪费时间了。"

V1 cohortAge 18–24Income Over $100,000

"It makes noticing the difference easier and helps me make a more informed decision."

"更容易看出差别,帮我做出更知情的选择。"

V1 cohortAge 35–44Income $50,000–$74,999

"I would go with comparative because it makes it easier to compare the different plans side by side and quickly see the differences."

"我选对比版,并排看差异最快。"

V2 cohortAge 25–34Income Over $100,000Sub $20–$29.99

"The standalone design allows each plan to be viewed individually, giving users the space to read and consider each option before deciding."

"单独展示让每个方案有足够空间,用户可以慢慢读、慢慢想。"

V1 cohortAge 35–44Income Over $100,000
Visual Stimulus
Standalone vs Comparative 布局对比
用户视角总结
用户喜欢对比布局,因为
  • 一屏看完所有档位,扫读效率高
  • 差异一目了然,不需要记忆就能判断
  • 来回翻页打断决策流程,还让人怀疑信息被隐藏
用户喜欢单独展示,因为
  • 每个方案有足够空间深入展示,不拥挤
  • 可以专注于单个方案,不被其他选项干扰
  • 信息层次更清晰,逐项理解感更强
Tapo Care 的设计回应
  • 订阅计划默认并排展示,功能差异在同一屏幕上可见
  • 明确标注各计划的包含项与不包含项,差异点突出显示
  • 推荐计划通过视觉层级而非强制弹窗引导,保留用户自主选择空间
  • 对比表格保留足够的行间距和白空间,避免信息密度过载
  • 可探索提供"单计划聚焦"视图作为辅助入口,但默认不使用
Quant support(辅证):V1 matrix (n=254) 偏 Comparative 72.0% / Standalone 20.1%;V2 inverse slider (n=38) 偏 Comparative 60.5% / Standalone 36.8%。7 个维度中共识方向最稳定的一项,V1 与 V2 方向一致,跨年龄、收入、订阅档全部偏 Comparative,无显著 cohort 差异。
4
Simple vs Detailed
"I want detail, but don't drown me"
● 中等共识
设计原则
用户不是不要详情——他们要的是"我想要的时候能拿到",而不是默认被淹没;progressive disclosure 是两端用户都满意的答案。

这个维度是 meta-insight 的核心证据。两端用户都有充分理由:简洁版避免了信息过载,详细版提供了信任感和判断依据。量化数据出现最大的 V1/V2 翻转,但 qualitative 揭示真相:问题不在于选哪边,而在于如何设计层次。

量化分布 · Quantitative Distribution
V1 matrix (n=254)
24.8%
68.5%
V2 slider (n=38)
55.3%
36.8%
Simple
中立
Detailed
用户评论

"The more words actually turned me off, and I end up reading none of it."

"字一多我就划走,根本不看了。"

V2 cohortAge 25–34Income $150,000+Sub $10–$19.99

"The simple version is easier to read. The detail version is very congested with information."

"简版好读多了,详细版信息塞得太满,喘不过气。"

V1 cohortAge 45–54Income $50,000–$74,999Sub $20–$29.99

"I like details to be available if needed, but when taking quick glances I would prefer the basics."

"细节能查到就行,随手翻的时候我只想看重点。"

V1 cohortAge 45–54Income Over $100,000

"For at-a-glance information I prefer simple, but for more explanation I would want detailed — it just depends on the situation."

"快速看用简版,想搞清楚再切详细——看需求吧,不是非此即彼。"

V1 cohortAge 25–34Income $150,000+Sub $40+

"Having it more detailed makes me believe it is more legit / worth my money."

"细节越多越觉得靠谱,觉得花的钱有价值。"

V1 cohortAge 18–24Income $50,000–$74,999Sub $10–$19.99

"A detailed information helps me make my decisions faster."

"详细信息反而帮我更快做决定。"

V1 cohortAge 25–34Income $25,000–$49,999

"I prefer the detailed one as it clearly shows you what you're paying for."

"我选详细版,能清楚看到自己在付什么钱。"

V1 cohortAge 35–44Income Over $100,000

"I prefer things to be easy to glance and find than having to read and get more confused."

"我更喜欢扫一眼就找到的,读太多反而更迷。"

V1 cohortAge 25–34Income Under $25,000Sub $10–$19.99
Visual Stimulus
Simple vs Detailed 信息密度对比
用户视角总结
偏好简洁版的用户看重
  • 扫读效率,一眼抓住关键信息
  • 信息过载会直接触发回避行为,字多反而什么都没读
  • 在不确定感兴趣之前,不想被大量信息轰炸
  • (多见于 25–34 岁、习惯快速扫读的用户)
偏好详细版的用户看重
  • 知道自己在买什么,越透明越信任
  • 详情是信任信号,帮助他们更快做决定
  • 掌握完整信息后才有安全感去订阅
  • (多见于 35+ 岁、需要更多上下文建立判断的用户)
Tapo Care 的设计回应
  • 首屏以关键权益卡片为主,文字精简可扫读,避免段落式说明文字
  • 提供"了解更多"或折叠展开入口,让需要详情的用户主动获取
  • 权益条目使用短句,优先关键词而非完整句子
  • 展开后的详情区域信息层次清晰,不与主流程争夺视觉注意力
  • 35+ 用户路径:确保详情入口足够显眼,不需要用户"猜测"是否有更多信息
Quant support(辅证):V1 matrix (n=254) 偏 Detailed 68.5% / Simple 24.8%;V2 inverse slider (n=38) 翻转:Simple 55.3% / Detailed 36.8%。显著年龄差异:35+ 偏 Detailed 74.7% vs <35 仅 59.0%(差 15.7pp),强证据支持 progressive disclosure 策略。
5
Feature vs Scenario
"Tell me what I'm paying for"
● 五五开
设计原则
功能列表和场景示例都在回答同一个问题"我买到了什么"——两者不是竞争关系,而是同一个 need 的不同入口。

V2 数据精确五五开,不代表用户没有偏好——而是人群里有两批用户,各自以不同路径建立判断。年龄差异显著:35+ 更偏 Scenario,<35 更偏 Feature。设计的解答是让两者都出现,但用信息层级引导用户按自己的路径深入。

量化分布 · Quantitative Distribution
V1 matrix (n=254)
28.3%
11.5%
60.2%
V2 slider (n=38)
47.4%
47.4%
Feature
中立
Scenario
用户评论

"Like to know the exact features I have vs a scenario that might not apply to me."

"我要知道我买了哪些功能,场景举例不一定跟我有关。"

V1 cohortAge 25–34Income Under $25,000Sub $10–$19.99

"I'm 100% team features — the number one way to sell me is to show me exactly what's included, because then in my head I feel like I know what I'm getting."

"我铁定选功能列表——把包含什么列清楚,我心里才有底。"

V2 cohortAge 25–34Income Over $100,000Sub $10–$19.99

"The scenarios help me better see why the product may be of use to me."

"场景举例能帮我想清楚这个产品对我有什么用。"

V1 cohortAge 45–54Income $100,000–$149,999Sub Under $10

"It feels more relatable and helps me picture how the product would fit into real everyday life."

"这种写法更有代入感,能帮我想象产品放到日常生活里是什么样。"

V2 cohortAge 25–34Income Over $100,000Sub $20–$29.99

"A mix of both is best — one helps showcase while the other gives more feature details."

"两者结合最好——一个展示场景,另一个给出功能细节。"

V2 cohortAge 18–24Income $100,000–$149,999Sub $10–$19.99

"I prefer scenario-focused because it shows real-life use cases and makes the value of the security features clearer."

"我选场景式,因为真实用例能让安防功能的价值更清晰。"

V1 cohortAge 25–34Income $50,000–$74,999

"Feature focused is better — I don't need to imagine scenarios."

"功能列表更好——我不需要靠场景联想,直接告诉我有什么。"

V1 cohortAge 18–24Income $50,000–$74,999

"I like both but strongly prefer scenario focused because it makes it easier to imagine how it would directly help my life."

"两个都不错但我更倾向场景式,更容易想象产品在我生活里的样子。"

V1 cohortAge 35–44Income $25,000–$49,999Sub Under $10
Visual Stimulus
Feature vs Scenario 内容组织对比
用户视角总结
偏好功能列表的用户看重
  • 明确知道自己买了什么,透明清单带来安全感
  • 自己会根据功能判断哪些场景适用,不需要被引导
  • 扫读功能清单比阅读场景叙述更快,效率优先
  • (多见于 25–34 岁、技术熟悉度高的用户)
偏好场景示例的用户看重
  • 能把抽象功能和自己的真实生活挂钩
  • 场景让功能的价值更直观,帮助建立代入感
  • 理解产品价值后更容易做出订阅决策
  • (多见于 35+ 岁、需要更多上下文的用户)
Tapo Care 的设计回应
  • 功能条目作为主要信息层,清晰列出每个订阅档包含的具体功能
  • 场景示例作为辅助层,配合功能点说明真实应用价值(非替代,是增强)
  • 场景与功能之间有明确对应关系,避免模糊的一对多归因
  • 场景内容覆盖多样家庭情境(包裹保护、老人看护、宠物监控等),提升相关性
  • 避免用夸张或非典型场景(入室盗窃等)营造恐惧感
Quant support(辅证):V1 matrix (n=254) 偏 Scenario 60.2% / Feature 28.3%;V2 inverse slider (n=38) 精确五五开:Feature 47.4% / Scenario 47.4%。显著年龄差异:35+ 偏 Scenario 65.6% vs <35 仅 52.0%(差 13.6pp)。强证据支持 both-and 策略,待 v1 行为数据验证主次结构。
6
Text-heavy vs Visual-rich
"Scannable first, deep when I dig"
● 五五开
设计原则
视觉先行帮助用户建立关注,文字按需服务理性判断——这是同一个信息需求在不同阶段的表现。

这个维度和 Need 4(Simple/Detailed)、Need 5(Feature/Scenario)形成三角关系——三者都指向同一个 meta-pattern:用户在扫读层需要视觉/简洁,在深入层需要文字/细节。V2 五五开不代表用户无所谓,而代表这两个层次都是真实需求。

量化分布 · Quantitative Distribution
V1 matrix (n=254)
63.4%
10.2%
26.4%
V2 slider (n=38)
42.1%
15.8%
42.1%
Visual-rich
中立
Text-heavy
用户评论

"I like the visual rich side way better — too much information makes people zone out."

"视觉版好多了——信息一多人就开始走神,看不进去。"

V1 cohortAge 18–24Income Under $25,000Sub $10–$19.99

"People tend to quickly lose interest with text-heavy designs even though it is more informative."

"文字多的设计虽然信息量大,但人很快就失去兴趣了。"

V2 cohortAge 18–24Income Under $25,000Sub Under $10

"As much as I enjoy heavy visuals, text and words are better than visuals when it comes to describing a security subscription."

"我也爱视觉,但安防订阅这种东西,文字说得比图清楚。"

V1 cohortAge 25–34Income $50,000–$74,999

"I don't want too much text before I've decided that I care. Once I care, then I'll take the time to read."

"在我还没决定感不感兴趣之前,不要给我太多字。等我感兴趣了,我自然会花时间读。"

V2 cohortAge 55–64Income $50,000–$74,999Sub Under $10

"I like this one because it clearly outlines what the plan has and does not have."

"我喜欢这个,包含什么、不包含什么写得清清楚楚。"

V1 cohortAge 25–34Income $100,000–$149,999Sub $20–$29.99

"I prefer the text-heavy style because it clearly explains the features and pricing without guessing what's included."

"我更喜欢文字多的版本,功能和价格说清楚了,不用猜。"

V2 cohortAge 25–34Income $75,000–$99,999Sub $10–$19.99

"I'm split — I think you need to find a balance between text-heavy and visual-heavy."

"我两个都有点,觉得应该在文字和视觉之间找到平衡。"

V1 cohortAge 18–24Income Over $100,000

"Visual-rich is better because most people won't feel like reading constant text. They'll eventually burn out and skim."

"视觉版更好,大多数人不想一直读字,迟早会疲倦然后开始跳读。"

V1 cohortAge 25–34Income $25,000–$49,999
Visual Stimulus
Text-heavy vs Visual-rich 呈现风格对比
用户视角总结
偏好视觉优先的用户看重
  • 在决定是否感兴趣之前,不想被大量文字占据注意力
  • 视觉帮助快速建立产品认知,降低进入门槛
  • 文字密度高时大脑会主动放弃处理,反而什么都没留下
偏好文字详情的用户看重
  • 安防订阅是需要理性判断的决策,文字比图更精确
  • 文字把包含项和不包含项说清楚,减少模糊和猜测
  • 掌握完整文字信息后才有安全感下决定
Tapo Care 的设计回应
  • 首屏以视觉元素(图标、图片、色块)建立快速认知,减少首屏文字量
  • 视觉优先展示,文字详情按需展开(progressive disclosure)
  • 图标和配图有明确语义,每个视觉元素传达一个清晰信息点,不作纯装饰
  • 文字部分排版清晰,行距和字号适合快速阅读,避免段落密度过高
  • 视觉和文字在信息层级上有明确主次,不互相争夺注意力
Quant support(辅证):V1 matrix (n=254) 偏 Visual-rich 63.4% / Text-heavy 26.4%;V2 inverse slider (n=38) 精确五五开:Text-heavy 42.1% / Visual-rich 42.1%。与 Feature/Scenario 维度呈现相同 pattern。跨 cohort 无显著差异,待 v1 行为数据验证主次结构。
7
Abstract vs Explicit
"Premium feel, without losing clarity"
● 混合
设计原则
用户想要一个有品质感的产品,但不能以牺牲信息清晰度为代价——Abstract 做视觉语言,Explicit 做信息主层,两者可以共存。

这是 7 个维度里唯一真正的"混合"结论。V1 偏 Explicit(58.3%),V2 却翻转至 Abstract(44.7%),且中立比例最高。用户对"游戏化"或"过度风格化"设计有强烈反感,但对"克制的现代美学"持开放态度。

量化分布 · Quantitative Distribution
V1 matrix (n=254)
22.4%
19.3%
58.3%
V2 slider (n=38)
44.7%
18.4%
36.8%
Abstract
中立
Explicit
用户评论

"Rather have a direct message than have to try to find out what they're trying to convey."

"直接说清楚就好,别让我猜你想表达什么。"

V1 cohortAge 45–54Income $25,000–$49,999Sub Under $10

"I prefer explicit because it's not too wordy and it gets to the point of the information needed."

"我选明确直白那版,不啰嗦,把该说的信息说到位。"

V1 cohortAge 25–34Income $25,000–$49,999

"I would go with Abstract because it looks more premium, modern and gives the app a more polished feel."

"我选抽象风——看起来更高级、更现代,整个 app 质感也上来了。"

V2 cohortAge 25–34Income Over $100,000Sub $20–$29.99

"I definitely prefer the abstract; the ones on the right felt gimmicky."

"我更喜欢抽象风,另一个感觉太花哨了。"

V1 cohortAge 45–54Income Over $100,000

"Nobody wants to be bombarded with gamey aesthetics when looking for a subscription — this is not a game, it's security."

"订阅安防服务,没人想被游戏风设计轰炸——这不是游戏,是安全。"

V1 cohortAge 18–24Income $25,000–$49,999

"I don't know that I fully understand the explicit option so the abstract makes sense."

"我没完全看懂那个明确版,所以感觉抽象版反而更合理。"

V1 cohortAge 25–34Income $75,000–$99,999Sub $10–$19.99

"I prefer a more explicit design because it clearly shows what the product does and how it helps in real life situations."

"我更喜欢明确版,清楚展示产品能做什么、在真实场景里怎么帮到我。"

V1 cohortAge 25–34Income $50,000–$74,999

"I feel they are both too busy and hard to read."

"两个感觉都太乱,读起来费劲。"

V1 cohortAge 45–54Income $75,000–$99,999Sub $10–$19.99
Visual Stimulus
Abstract vs Explicit 视觉风格对比
用户视角总结
偏好 Abstract 的用户看重
  • 现代感和品质感,克制的视觉语言传达专业
  • 过度风格化(游戏感、花哨)不适合安防场景
  • (多见于高收入用户和对品质感有要求的用户)
偏好 Explicit 的用户看重
  • 信息直接,不需要解读或猜测意图
  • 安防场景下"看得懂"本身就是信任的来源
  • (多见于年长用户和偏好实用信息的用户)
Tapo Care 的设计回应
  • v1 并行探索两条路径:以 Explicit 为信息主层(清晰权益说明),以 Abstract 为视觉语言(留白、现代感、克制色彩)
  • 操作文案直接表达动作(如"订阅 Basic"),权益描述具体可量化
  • 视觉层保持克制,留白增加品质感,避免过度装饰
  • 避免游戏化或过于强烈的风格化元素(强对比色、徽章堆砌、动画过载)
  • Abstract/Explicit 的 A/B 测试设计纳入 v1 后续计划,以转化率数据定方向
Quant support(辅证):V1 matrix (n=254) 偏 Explicit 58.3% / Abstract 22.4%,中立 19.3%;V2 inverse slider (n=38) 翻转:Abstract 44.7% / Explicit 36.8%,中立 18.4%。7 个维度中中立比例最高,证实"真实混合"。显著订阅档差异:低档(<$20)偏 Abstract 32.7% vs 高档($20+)仅 16.0%(差 16.7pp,潜在 monetization 信号)。

跨维度洞察

1. Progressive disclosure 是 7 个维度的统一答案

Need 4(Simple/Detailed)、Need 5(Feature/Scenario)、Need 6(Text/Visual)三个维度的用户评论,表面上看是在 A 和 B 之间选边站,但仔细阅读会发现他们说的是同一件事:默认给我轻量的版本,让我在需要时能找到深度信息。这就是 progressive disclosure 的设计逻辑——不是折中,而是对用户真实心智模型的映射。V2 量化数据在这三个维度都呈现五五开,也印证了"两端用户都存在,设计需要同时服务"的结论。

2. 年龄对信息密度容忍度的影响

两个维度都出现了显著的年龄差异:Simple/Detailed 中,35+ 偏 Detailed(74.7% vs <35 的 59.0%,差 15.7pp);Feature/Scenario 中,35+ 偏 Scenario(65.6% vs <35 偏 Feature,差 13.6pp)。这两个差异指向同一个方向:年长用户需要更多上下文信息来建立判断,年轻用户更倾向于高效扫读功能清单。设计含义是:progressive disclosure 的"展开入口"需要对 35+ 用户足够显眼,不能藏在角落里需要用户主动寻找。

3. Hypothetical bias 在 quant 评分中的表现

本研究 7 个维度中 6 个出现 V1 vs V2 偏好方向 ≥10pp 的差值,其中 Intuitive/Emotional(V1 偏 Emotional 53.5% → V2 偏 Intuitive 68.4%)和 Real Photos/Illustrations(V1 偏 Illustrations 52.8% → V2 偏 Real Photos 65.8%)反差最为显著。Matrix 呈现格式倾向放大社会期望偏差,参与者倾向给出"理想状态的答案"而非真实偏好。这是本报告优先呈现用户原话而非评分 % 的方法论原因:用户描述自己行为的语言,比他们在量表上打分,更能反映真实的决策逻辑。

建议清单

Need / Pattern Recommendation Owner Priority Validation
Need 1 · Real Photos · 强共识 订阅页主视觉使用真实家居场景照片,避免插画和 AI 合成人物 UI / Content P0 Done by research(V2 + qualitative 双重确认)
Need 2 · Intuitive · 强共识 文案直接描述权益,删除所有恐惧/焦虑语言;操作路径透明 Content / UX P0 Done by research(V2 反差最大,qualitative 高度一致)
Need 3 · Comparative · 强共识 订阅计划默认并排对比布局,明确标注差异点 UX / UI P0 Done by research(7 个维度中共识最稳定)
Need 4 · Simple/Detailed · 中等共识 首屏简洁概览 + 可展开的详情入口;35+ 用户路径:详情入口显眼 UX / UI P0 v1 usability test(重点验证 35+ 能否找到详情入口)
Need 5 · Feature/Scenario · 五五开 功能列表为主层,场景示例为辅助层;两者有明确对应关系 Content / UX P1 v1 行为数据(click-through rate 功能条目 vs 场景展开)
Need 6 · Text/Visual · 五五开 视觉优先建立第一印象,文字详情按需展开;图标有明确语义 UI / UX P1 v1 行为数据(停留时长:visual 区域 vs text 区域)
Need 7 · Abstract/Explicit · 混合 v1 并行探索两条路径,Explicit 为信息主层,Abstract 为视觉语言 UI / PM P1 v1 usability test;后续独立 A/B(以转化率为主指标)
Cross-cutting · Progressive disclosure v1 全站采用 progressive disclosure 信息架构,统一 Need 4/5/6 的实现逻辑 UX P0 v1 usability test(n=5–8,重点验证两端用户路径)
Monetization hypothesis Abstract 美学作为低档位用户升档触发效应的独立 A/B 实验 PM + Growth P2 独立 A/B 实验(以 upgrade conversion rate 为主指标)
完整 DESIGN DECK · FIGMA
Tapo Care Semantic Differential Scale Synthesis ↗

含完整调研流程、原始数据、quote affinity board、设计探索方向